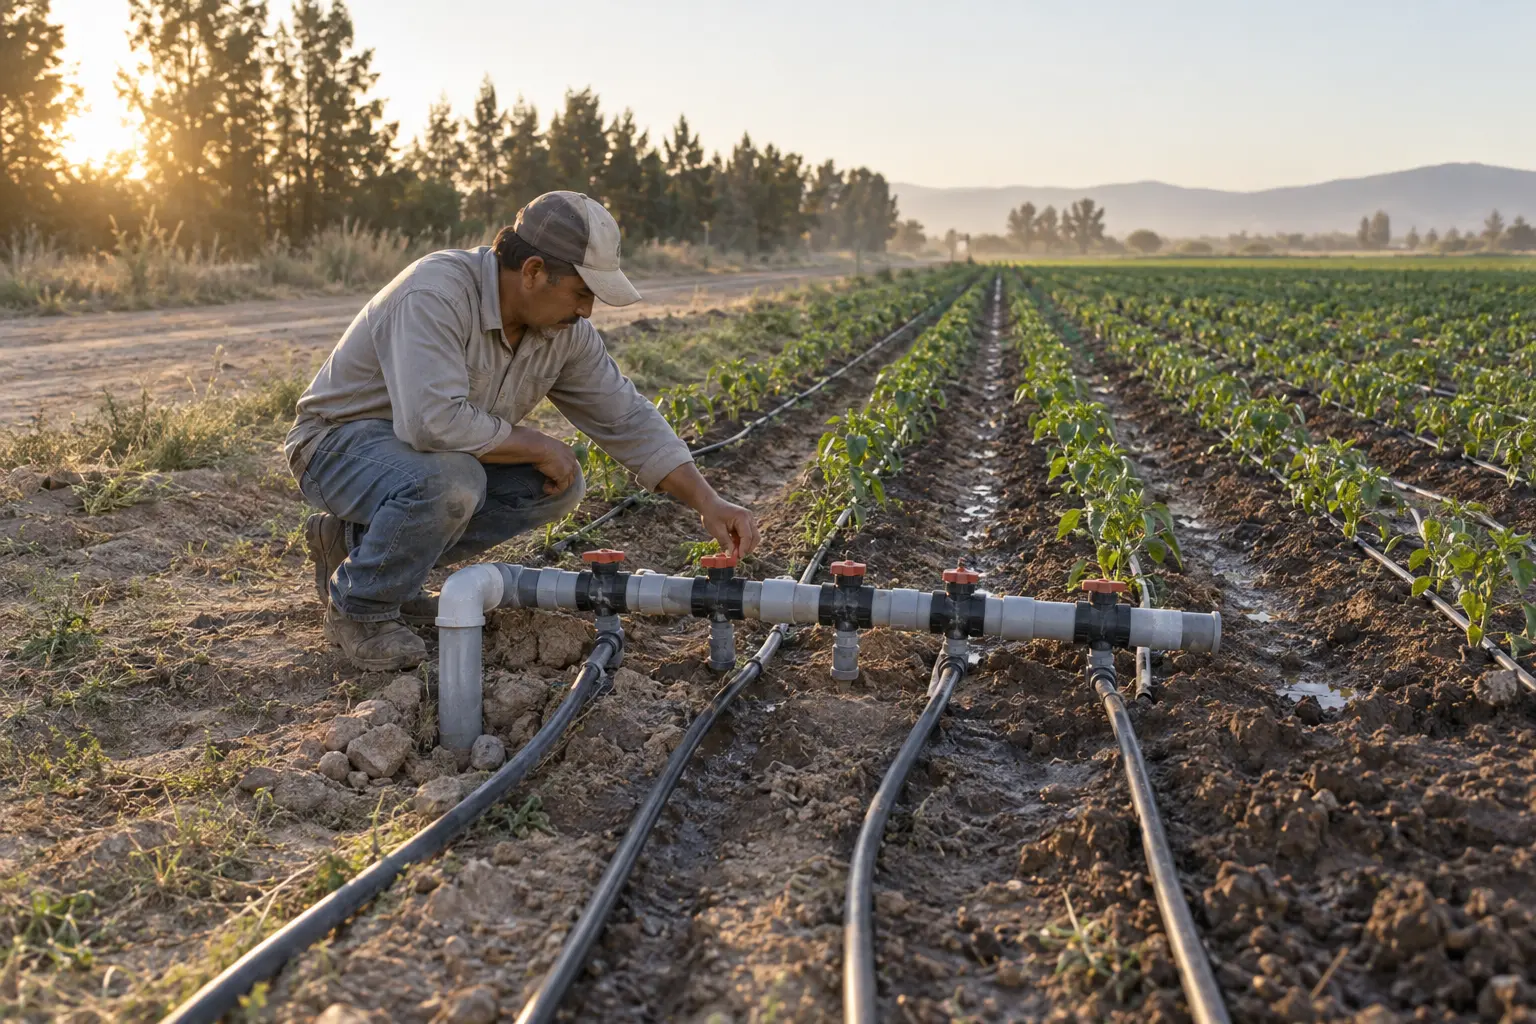
A drip system is designed around numbers: litres per hour per emitter, cubic metres per hour per zone, millimetres per irrigation. Once the system is in the ground, a water meter on each valve zone is how you find out whether those numbers still hold. This guide covers why each zone deserves its own meter, how to read the ratings printed on a meter and size it from them, where it goes relative to the filter, the air valve and the fertilizer injector, and how to bring the reading back to the office.
Why meter each valve zone
A single meter at the pump tells you how much water left the head. A meter on each valve tells you where it went. Four everyday questions need the zone meter.
- Did the zone get its plan? An irrigation plan is a volume per zone, or a depth in mm that converts to a volume through the zone’s area. The meter’s total for the cycle is the volume that was applied. When the two disagree, start looking in that zone: its pressure, its valve, or one of the faults below.
- Is there a leak or a burst lateral? A zone that draws more water than its usual flow, at the same pressure, is losing it somewhere. The University of California’s microirrigation maintenance guide puts it directly: “If pressure is held constant, an increase in flow rate may indicate leaks” (UC ANR).
- Are emitters or filters clogging? This is the opposite trend: a slow decline in flow over weeks. The same guide notes that meters close to the laterals detect clogging more readily than one meter at the head, and that flow records only compare when they are taken at the same operating pressure. Log pressure next to flow.
- Is the fertigation dose right? A fertilizer program can be written as litres of stock solution per cubic metre of water. The zone meter supplies the cubic metres. Divide the stock solution used in a cycle by the water the meter recorded and compare it with the recipe. With a recipe of 2 L/m³, for example, a cycle that used 45 L of solution on 30 m³ of water ran at 1.5 L/m³, a quarter below plan. An injector that drifts shows up the same day.
The ratings on a water meter: Q3, R, Q1, Q2 and Q4
The ratings come from OIML R 49, whose content is the same in substance as ISO 4064-1:2014 (OIML R 49-1:2013, foreword). A meter is designated by two values, Q3 and the ratio R, and both are marked on the meter. Everything else follows from them.
- Q3, permanent flow rate. The highest flow at which the meter is to operate within its permitted error under rated conditions, in m³/h. Q3 comes from a fixed series: 1, 1.6, 2.5, 4, 6.3, 10, 16, 25, 40, 63 m³/h and upward.
- R = Q3/Q1. Also from a fixed series: 40, 50, 63, 80, 100, 125, 160, 200, 250 and upward. A higher R means the meter measures lower flows within its error limits.
- Q1 = Q3/R, minimum flow rate. The lowest flow at which the meter is to operate within its permitted error. Below Q1 the standard sets no accuracy requirement at all.
- Q2 = 1.6 x Q1, transitional flow rate. It divides the range into a lower zone and an upper zone.
- Q4 = 1.25 x Q3, overload flow rate. The meter handles it for a short period. Its rated operating range is Q1 to Q3.
The manufacturer states the accuracy class on the meter or its datasheet. For an accuracy class 2 meter, the maximum permissible error is ±5% in the lower zone (Q1 up to Q2) and ±2% in the upper zone (Q2 to Q4) for water from 0.1 °C to 30 °C, widening to ±3% above 30 °C. Class 1 tightens these to ±3% and ±1% (OIML R 49-1:2013, clauses 4.1 and 4.2).
| Rating | How it is found | DN20 meter, Q3 = 4.0 m³/h, R80 |
|---|---|---|
| Q3 | Marked on the meter | 4.0 m³/h |
| R | Marked on the meter | 80 |
| Q1 | Q3 / R | 50 L/h |
| Q2 | 1.6 x Q1 | 80 L/h |
| Q4 | 1.25 x Q3 | 5.0 m³/h |
| Error from Q1 to Q2 | Class 2 | ±5% |
| Error from Q2 to Q4 | Class 2, water up to 30 °C | ±2% |
Sizing a meter for a drip zone
Sizing starts with the zone flow:
Zone flow (L/h) = number of emitters x emitter flow (L/h)
The number of emitters is the total length of drip line in the zone divided by the emitter spacing. Use the emitter’s flow at the pressure the zone actually runs at. Then choose a meter whose Q3 sits above the zone flow, and check where its Q2 falls.
Worked example: what a DN20 meter covers
Take emitters of 2.0 L/h every 0.5 m, on laterals 1.0 m apart. Each metre of drip line carries two emitters, so it draws 4.0 L/h, and each square metre of the zone receives 4.0 L/h. One litre on one square metre is one millimetre, so this layout applies 4 mm/h.
With the DN20 meter from the table (Q3 = 4.0 m³/h, R80):
- At Q3, 4,000 L/h: 2,000 emitters, 1,000 m of drip line, a zone of 1,000 m² (0.1 ha).
- At Q2, 80 L/h: 40 emitters, 20 m of drip line.
- At Q1, 50 L/h: 25 emitters, 12.5 m of drip line.
At this spacing the meter stays within ±2% for anything from a single 20 m line up to a 0.1 ha zone. Run the zone below Q3 with some headroom: flushing the laterals, or a burst one, raises the flow, and the meter’s rated range ends at Q3. Q4 (5.0 m³/h here) is for short periods only.
Larger zones and the role of R
The same layout over 0.5 ha draws 5,000 m² x 4 L/h = 20,000 L/h, or 20 m³/h. The next Q3 in the series is 25 m³/h, and that is where meters in DN25 to DN50 bodies come in. Read Q3 and R off the marking rather than assuming them from the pipe size: two meters with the same DN can carry different ratings.
At this size R decides how much of the low end you keep:
- Q3 = 25 m³/h with R80: Q1 = 312.5 L/h, Q2 = 500 L/h.
- Q3 = 25 m³/h with R160: Q1 = 156 L/h, Q2 = 250 L/h.
The low end matters more than it looks. A valve that does not seal, or a leak upstream of the field while the zone should be idle, shows up as a small flow, and only a meter that measures small flows will show it.
Check the pressure loss as well. R 49 limits the loss through a meter to 0.63 bar between Q1 and Q3, and lower pressure loss classes go down to 0.10 bar (clause 6.5). In a drip zone that loss comes out of the pressure budget at the emitters, so where pressure is tight, choose a lower loss class or the next size up.
Main lines: electromagnetic meters
On the main from the pump or the reservoir, a mechanical meter becomes large and sits in the full flow, sand included. An electromagnetic meter measures the velocity of the water with no moving parts in the flow, so sand has nothing to wear. The EMF-200 insertion electromagnetic flow meter fits pipes from DN100 to DN3000 and installs through a saddle and ball valve without stopping the flow. Accuracy is ±1.5% of reading at velocities of 1 m/s and above, and the water needs a conductivity of at least 30 µS/cm. It wants 15 pipe diameters of straight pipe upstream and 10 downstream, mounted at the 3 or 9 o’clock position to keep the electrodes clear of sediment and air. It runs on 85-250 VAC or 20-36 VDC, so the pump station is its natural place.
Where the meter goes in the head and at the valve
On the irrigation head the order is filter, then meter, then fertilizer injection point.
- After the filter. Sand and debris wear a mechanical meter and lodge in it. R 49 notes that solid particles collect in water meters and that a strainer or filter upstream may be required (clause 6.3.2).
- Before the injection point. The meter then measures clean water only, and acid or concentrated fertilizer never passes through it. Zone meters further downstream see fertigated water at field dilution only.
- An air release valve upstream. Unless the emitters are non-drain types, drip zones partly drain through them after each cycle, and the next cycle pushes that air down the line. A mechanical meter counts moving air as water. Laboratory tests on pipes refilling after an interruption measured water meters over-reading from the air released through them, and tested air valves at different positions as a remedy (Ferrante et al., 2023). Put an air release valve at a high point upstream so the air leaves before it reaches the meter, and keep the meter away from high points: R 49 requires it to be installed so it is completely filled with water under normal conditions (clause 6.3.1).
- Orientation. A meter marked H may only be installed horizontally, and one marked V only vertically (clause 6.6.2).
- Straight pipe. The flow profile class is marked as a U and a D number: the straight length needed upstream and downstream, in multiples of the pipe diameter. U10 D5 means 10 x DN upstream and 5 x DN downstream; on a DN25 meter that is 250 mm before it and 125 mm after it. An S in the class (U10S) means a flow straightener is also needed. A meter with no class marked is U0/D0 and needs no straight run (clause 6.3 and tables 2 and 3).
- Unions and a bypass. Fit unions on both sides so the meter comes out for cleaning or checking without cutting pipe. On the head, a bypass with its own valves keeps irrigation running while the meter is out.
Outdoors: heat, sun and flooded pits
- Temperature class. T30 covers water from 0.1 °C to 30 °C and T50 from 0.1 °C to 50 °C. A meter without a temperature marking is T30 (R 49, table 1 and clause 6.6.2). If water reaches the meter through exposed pipe or from a tank in the sun, measure its temperature in midsummer before choosing the class.
- Sun. R 49 sets the rated ambient range at +5 °C to +55 °C (clause 6.4). A lid or a shaded meter box keeps the dial readable and the body cooler.
- Pits. Meter boxes flood. A meter in a pit, together with its pulse unit or communication module, should be rated IP68 for continuous immersion, with the cable entry sealed to the same standard.
Reading the meter remotely: pulse or RS485 Modbus
Pulse output. The meter closes a contact each time a fixed volume passes, with each pulse representing an elementary volume as R 49 puts it. The controller counts pulses into volume and derives the flow rate from the pulse rate. Two wires and nothing to configure beyond the volume per pulse. The limit is that the count lives in the controller: pulses that arrive while the counter is off are lost, and the meter’s own register becomes the reference.
RS485 Modbus. The meter keeps its own total and flow rate in registers, and the controller reads them. A communication gap loses no volume, because the next read returns the meter’s running total. An electromagnetic meter can expose more: the EMF-200 register map includes flow rate, velocity, forward and reverse totals and an empty pipe alarm. Several meters share one RS485 pair, each on its own address. For more on the protocol, see the sensor protocols guide.
Power cuts. A battery-powered electronic meter keeps counting when grid power drops. R 49 requires a meter with a replaceable battery to be marked with the latest date for replacing it (clause 6.6.2), so note that date in the maintenance plan.
Connecting zone meters to a controller
The Omni Genesis controller reads both pulse-output and RS485 Modbus water meters and sends the readings to the cloud over 4G-LTE. It runs on rechargeable batteries with solar charging, so logging continues through grid power cuts. Each zone’s volume and flow rate then sits on one dashboard: set a high and a low flow limit per zone to catch burst laterals and clogging, and compare each cycle’s volume with the plan. Agrinovo’s catalogue includes an RS485 Modbus water meter for zone lines and the EMF-200 for mains.
The same controller takes soil sensors, so the volume each zone received can sit next to what the soil did with it; the tensiometer guide covers that side. For choosing the field hardware itself, see the agricultural IoT data logger guide, and for fertigation monitoring with EC and pH, the strawberry substrate fertigation post.
To specify meters for a block, contact us with the zone flows, pipe sizes and where power is available on site.
Sources
- OIML R 49-1:2013, Water meters for cold potable water and hot water, Part 1: Metrological and technical requirements. oiml.org
- University of California Agriculture and Natural Resources, Maintenance of Microirrigation Systems: Drip tubing SDI systems. ucanr.edu
- Ferrante, M., Rogers, D., Mugabi, J. and Casinini, F. (2023). Addressing Water Meter Inaccuracies Caused By Intermittent Water Supply: A Laboratory Investigation of Remedial Measures. Water Resources Management 37, 3921-3933. doi.org/10.1007/s11269-023-03532-x
- AGRINOVO-EMF-200 datasheet, linked from the EMF-200 product page.